
Tan Kok Choon
Background: Mathematics, statistics
Focus of the hackathon: Digitalization, decarbonisation
Photos of the event

/w=3840,quality=80,fit=scale-down)


/w=3840,quality=80,fit=scale-down)

/w=3840,quality=80,fit=scale-down)
Submission Criteria & Recommendations

/w=3840,quality=80,fit=scale-down)
Criteria
- Accuracy
Use clean data, and clean processing (algorithm/code) to make recommendations that must also be specific
- Creativity and Innovation
- Clarity and effectiveness
No need to submit the code. They will look at the results, on a spreadsheet
The flowchart should be one page (out of 4 pages)
Your computation should back up your recommendation/solution
Abstract 200 words.
No background, history, no long-winded form. Go straight to the point, recommendation.
Rightship presentation
/w=3840,quality=80,fit=scale-down)
RightShip metrics
- Environmental
- GHG Rating
- Carbon Accounting
- Maritime Emission Portal
Social
- Crew Welfare
Safety Score
- Vessel Vetting
- Vessel Inspection
Types of Vessels
Regulators

Regulator: https://www.imo.org/ https://www.imo.org/en/OurWork/PartnershipsProjects/Pages/default.aspx
Safety, Security, Efficient, Environmentally friendly
Safety at sea SOLAS

MARPOL (The International Convention for the Prevention of Pollution from Ships)


/w=3840,quality=80,fit=scale-down)

/w=3840,quality=80,fit=scale-down)
/w=3840,quality=80,fit=scale-down)

/w=3840,quality=80,fit=scale-down)


Most graphics and data from this single page: https://unctad.org/publication/review-maritime-transport-2023
BHP, 3% of global marine shipping, Australian mining primarily
Gas emissions

/w=3840,quality=80,fit=scale-down)
- Co2
- CH2
- N2O Nitrous Oxyde
- HFCs
- PFCs
- SFs
- NFs
Targets

What do you think will help you most achieve zero emissions?
- Future fuels
- Which future fuels will be zero
- Blue Ammonia, produced with renewables
- Nuclear
- LNG is about -20% in GHG emissions

Figure 1: Historical and projected transport demand and GHG emissions from international Shipping| Source: UNEP, World Bank

Python, coding
GIS


/w=3840,quality=80,fit=scale-down)


/w=3840,quality=80,fit=scale-down)
/w=3840,quality=80,fit=scale-down)

/w=3840,quality=80,fit=scale-down)
- QGIS (GIS software): https://www.qgis.org/en/site/
- Geopandas (Python Library): https://geopandas.org/en/stable/
- Fionas (Python Library): https://pypi.org/project/fiona/
- Folium (Python Library): https://domino.ai/data-science-dictionary/folium | https://python-visualization.github.io/folium/latest/
- Kepler.gl (Python Library): https://kepler.gl/
- Google Earth (Basic Visualisation): https://earth.google.com/web/
- Kepler.gl (Basic Visualisation): https://kepler.gl/
- H3 Geospatial Functions (Databricks): https://docs.databricks.com/en/sql/language-manual/sql-ref-h3-geospatial-functions.html
- Mosaic (Databricks): https://www.databricks.com/blog/databricks-mosaicml
Important discussion after the talks
- What is the port of Singapore looking up to in terms of Digitalisation and Decarbonisation? Rotterdam
- How is improvement driven in Europe VS Asia? Europe innovate mostly with regulation (stick) and Asia more with incentives (carrots).
- What are the main pain points for Singapore GHG emissions? Tug boats and supply vessels.
- Do you know of good tutorials to integrate real-time data on real-time GIS maps with Python? No, building one yourself is a great way to prepare for the hackathon
Training ourselves
Learn Python
Learn GIS
Learn to feed real-world shipping data in QGIS
Learn to build an AI from real-world shipping data in QGIS
Discussion
Routing optimisation
Fuel (colors of methanol, hydrogen…)
Direct Emission Capture
New Technology Adoption (wind, solar)
i)Source of Fuelk
ii)Energy Production :From coal, natural gas, solar, wind, hyrdogen, biogas, biofuel & nuclear
iii)
iv)Storage
v)Vessel:
Harbourcraft:Tugs, support, pilot, safety, OGV,
Timestamp, Name of ship, Type of ship, X, Y,
So if speed is 0, it’s in either anchoring mode or alongside mode
1)Vessel Movement
2)Load Adjustment factor
3)
i)Boiler (3 Rows) ii)Propulsion iii)Auxillary (20 Rows) iv)
Task 1: Calculate how much e emissions are for the 4 transits
Need to make a lot of assumptions for all e calculations (remember to state them in e paper)
Anchor Mode:
Load Factor: Ratio of e actual power output to e maximum rated power (maximum power capacity). The lower e actual power output (meaning e slower e ship is), e more
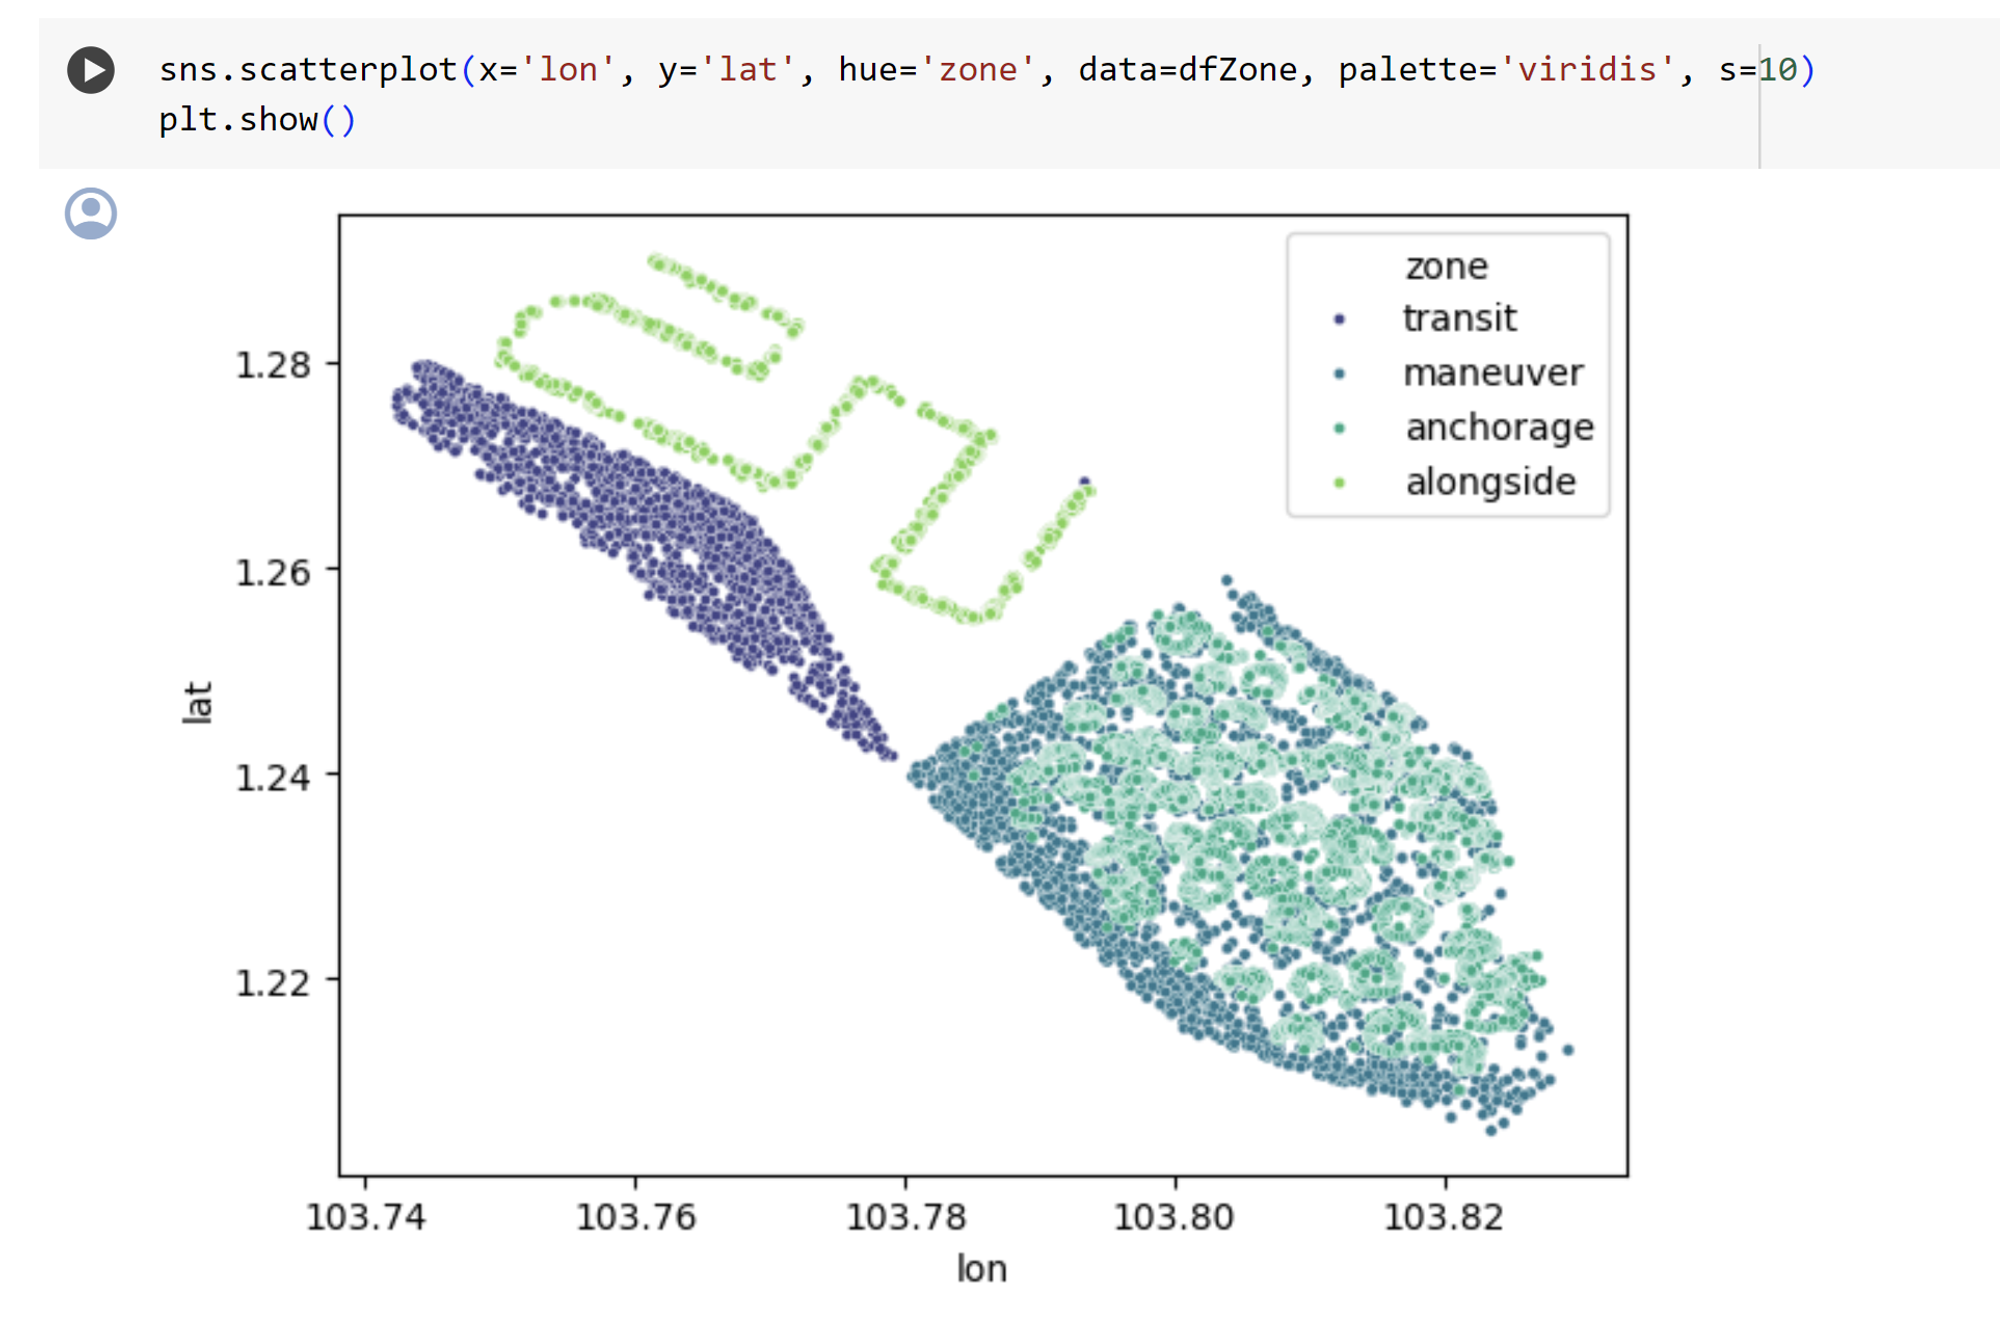
Transit Mode: If speed >1 OR navigational status is 0,3,4,8,11,12 and its OUTSIDE the maneuvering zone but inside the bigger port fence.
Anchorage mode:The vessel must be at an anchorage and non-moving (speed<1)
Maneuvering mode:If speed is >1 or navigational status =0,3,4,8,11,12 (considered ‘moving’ statuses) and it’s inside the maneuvering zone.
Alongside:The vessel must be berthed and speed<1. Note:If speed is >1, the mode is either transit or manoeuvre. When determining moving vessels, either speed or navigation status can be used.
Prepare for the Hackathon
#Data
#GHG Emission
#Real time / prediction
Make recomendations based on accurate data
Basic GIS training
Use Python Inside of QGIS https://www.youtube.com/watch?v=X-LvGvNor4E
Create a map of dangerous areas