🧔🏻
Cesar Jung-Harada 🌏
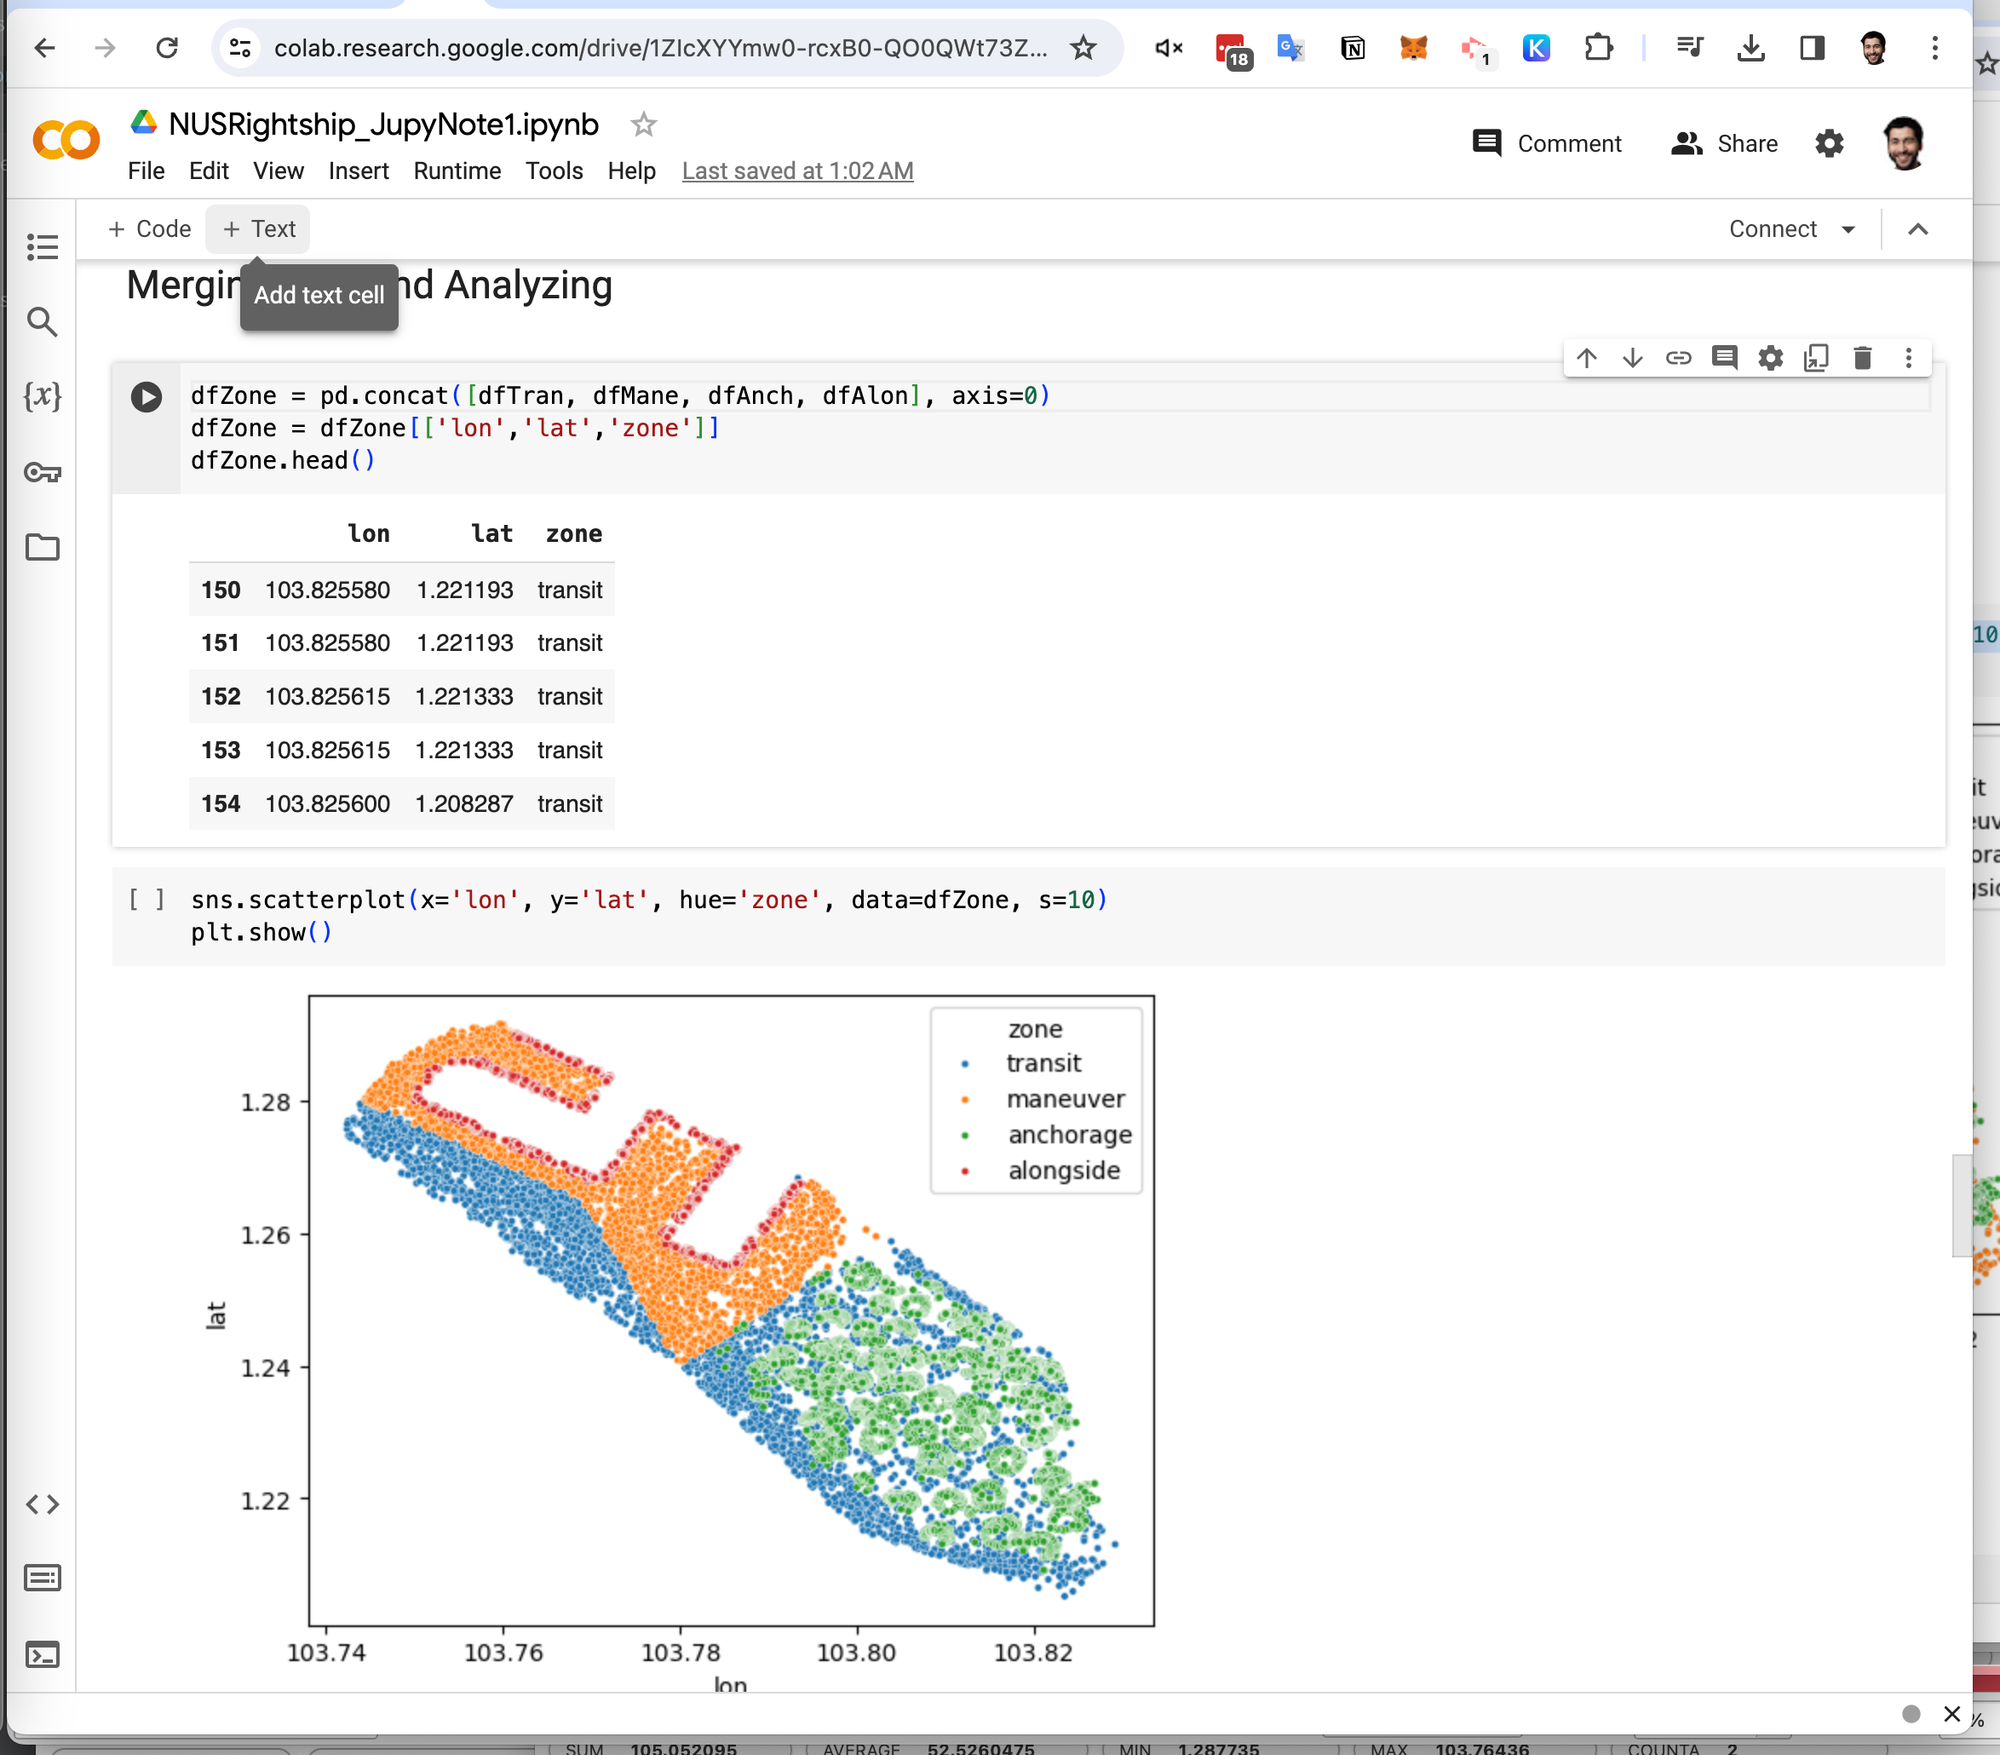
Scatterplot Graph Map
Copy
sns.scatterplot(x='lon', y='lat', hue='zone', data-dfZone, s=10) plt.show()